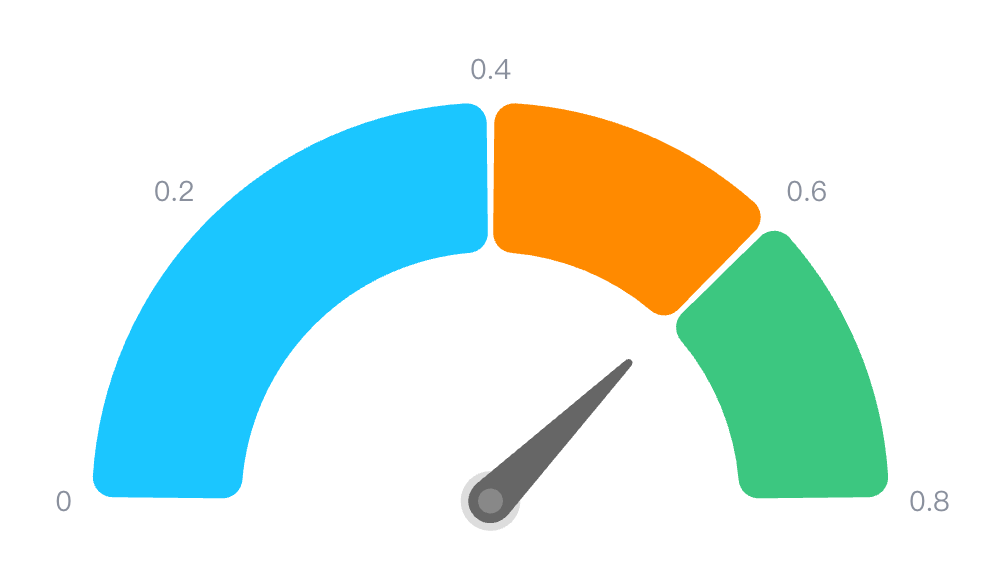
How to achieve background segmentation and rounded corner effect in a gauge chart?
Question Description
I saw this demo on the vchart website: https://www.visactor.io/vchart/demo/gauge-chart/clock
It looks like a variant of the gauge chart. Now I need to change the background of the regular gauge chart to a similar style, with segments and rounded corners. What should I do?
I had tried to add the circularProgress series to gauge chart. But I can't achieve background segmentation and rounded corner effect.
Solution
You can refer to the following demo and use another set of data to define background segmentation, and change the background series (corresponding attribute name of spec is "gauge") to the "gauge" series.
Code Example
Result

Quote
github:https://github.com/VisActor/VChart
gauge series spec: https://www.visactor.io/vchart/option/gaugeChart#gauge%EF%BC%88gauge%20%E7%B3%BB%E5%88%97%E7%89%88%E6%9C%AC%EF%BC%89.type('gauge')
